 |
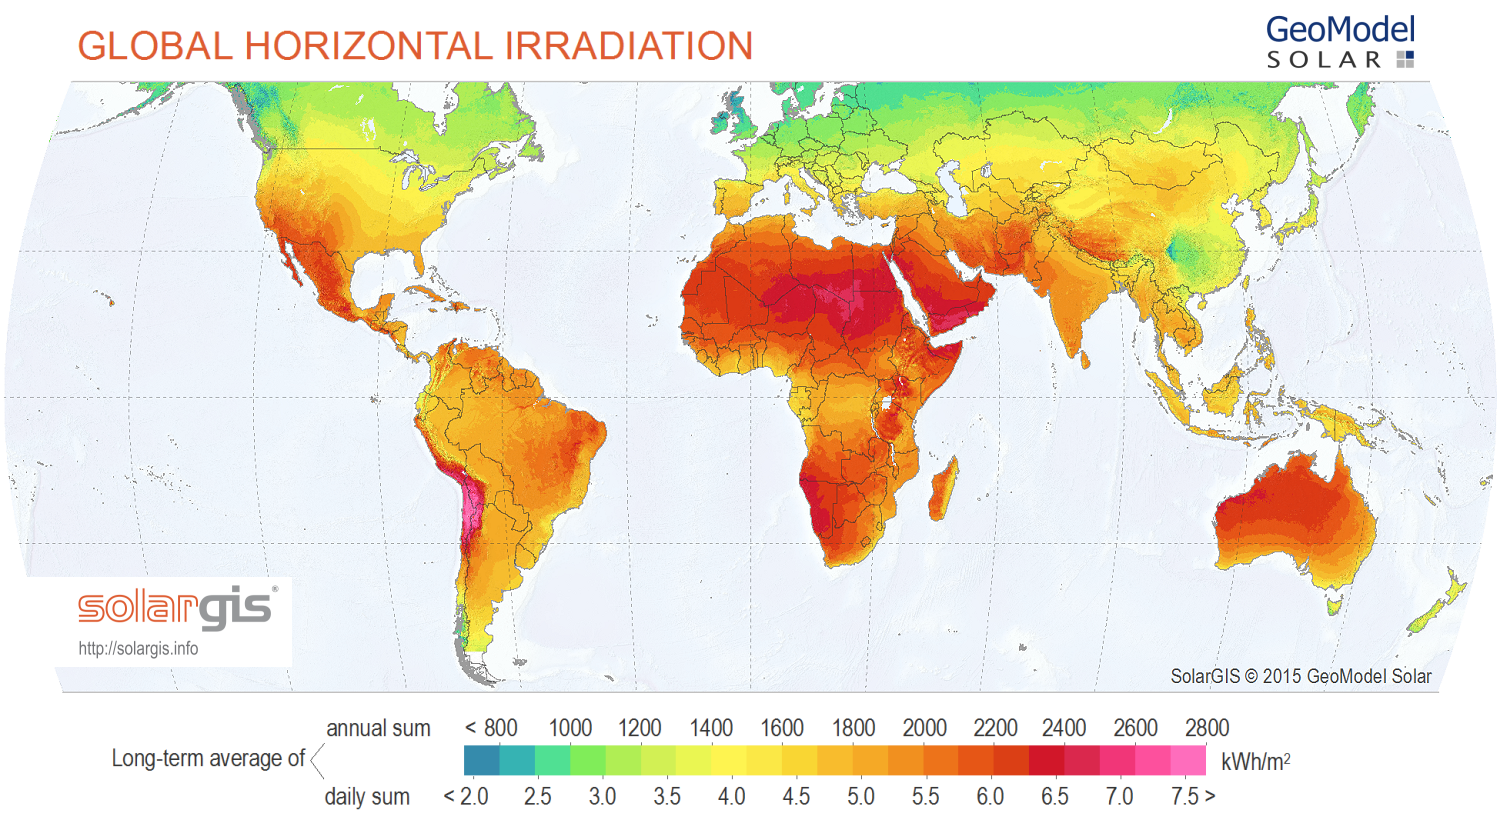
| Source: Solar GIS |
So here's what I found to start the comparison.
On the national level, Germany is really beating the US on the solar battlefield. According to TriplePundit, in June 2014, Germany reached over 50% of its electricity demand (23.1 GW) with solar power. Around that same time, the U.S. had just just .54% (20 GW).
Let's drill down to the city level. Here are some of the key statistics I found.
Population
-DC has 658,893 people (US Census Bureau 2014).
-Berlin has a population of 3,502,000 (2012 UN Data).
Area
-DC is 68.3 mi²
-Berlin is 344.3 mi²
Annual kWh of Sun per Meter Squared
According to Solar GIS (above)
-DC gets 1500 kWh/m2
-Berlin gets 1150 kWh/m2
Installed Solar Capacity
-DC has 17 MW of solar energy currently installed and ranks the district 34th in the country in installed solar capacity (SEIA's DC Solar Profile). Apparently that's enough to power 2,500 homes.
-Berlin has 83 MW of installed solar (Solar Power in Germany). Of the German federal states, Berlin ranks 14 out of 16 in installed solar capacity.
Highlights
-According to SEIA, DC has:
- 130 solar companies at work throughout the value chain in DC, employing 1,000 people.
- In 2015, $20 million was invested on solar installations. This represents a 132% increase over the previous year, and is expected to grow again this year.
- The Department of Energy’s Forrestal headquarters building is one of the largest solar installations, generating about 230,000 kw/h per year (US Energy Information Administration).
-Berlin has:
So what are our big takeaways? In terms of installed solar capacity, DC has .249 MW/mi² whereas Berlin has .241 MW/mi². DC has 1 MW for every 38,758 people whereas Berlin has 1 MW for every 42,1923. So even though Berlin has more installed solar capacity than DC, DC has more installed solar per mi² and per person than Berlin. WIN!!!!!
So we know what the cities can produce in terms of solar. Determining what solar they consume is a lot more difficult. Below are some graphs to help you understand what energy sources the cities are consuming. You can see that solar has a long way to go before is beats out other competitors like oil or natural gas.
- 17 solar companies (Google search)
- SEIA's counterpart is the German Solar Industry Association (GSIA). GSIA has 800 member companies and SEIA has 1,000. When you consider that GSIA is only seven years old (SEIA is 42) and Germany is 1/4 the population of the US, GSIA isn't doing too poorly.
So what are our big takeaways? In terms of installed solar capacity, DC has .249 MW/mi² whereas Berlin has .241 MW/mi². DC has 1 MW for every 38,758 people whereas Berlin has 1 MW for every 42,1923. So even though Berlin has more installed solar capacity than DC, DC has more installed solar per mi² and per person than Berlin. WIN!!!!!
So we know what the cities can produce in terms of solar. Determining what solar they consume is a lot more difficult. Below are some graphs to help you understand what energy sources the cities are consuming. You can see that solar has a long way to go before is beats out other competitors like oil or natural gas.
Final Berlin Energy Consumption for 2012: 262,326 terajoules. Source: Office for Statistics Berlin-Brandenburg, 2015. |
 |
Estimates of District of Columbia Energy Consumption for 2013: 180,188 terajoules
Source: EIA after converting Btu to terajoules
|
No comments:
Post a Comment