This doesn't have a lot to do with the 'Where's the Solar' theme. In early-March 2020, I finished reading Jared Diamond's book, Guns, Germs, and Steel. Although I enjoyed the read, his writing can get a bit dry. He makes his best arguments through tables and figures. So here's the collection, from beginning to end--it's basically like a PowerPoint presentation of Guns, Germs, and Steel.
All of these photos were taken and edited on my sad iPhone 5--click on the image to make it larger. Also, descriptions are down below all of the images. You also might get better quality by checking out this PDF from the Semantic Scholar.
All of these photos were taken and edited on my sad iPhone 5--click on the image to make it larger. Also, descriptions are down below all of the images. You also might get better quality by checking out this PDF from the Semantic Scholar.
Page 37. Figure 1.1. The spread of humans around the world.
Page 56. Figure 2.1. Polynesian islands. (Parentheses denote some non-Polynesian lands.)
Page 87. Figure 4.1. Schematic overview of the chains of causation leading up to proximate factors (such as guns, horses, and diseases) enabling some peoples to conquer other peoples, from ultimate factors (such as the orientation of continental axes). For example, diverse epidemic diseases of humans evolved in areas with many wild plant and animal species suitable for domestication, partly because the resulting crops and livestock helped feed dense societies in which epidemics could maintain themselves, and partly because the diseases evolved from germs of the domestic animals themselves.
Page 99. Figure 5.1. Centers of origin of food production. A question mark indicates some uncertainty whether the rise of food production at that center was really uninfluenced by the spread of food production from other centers, or (in the case of New Guinea) what the earliest crops were.
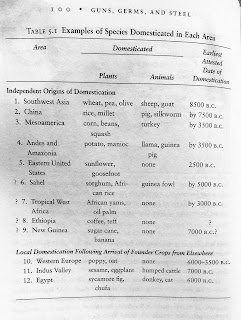
Page 100. Table 5.1.
Page 126-127. Table 7.1. Examples of Early Major Crop Types around the Ancient World.
Page 135. Figure 8.1. The Fertile Crescent, encompassing sites of food production before 7000 B.C.
Page 139. Figure 8.2. The world's zones of the Mediterranean climate.
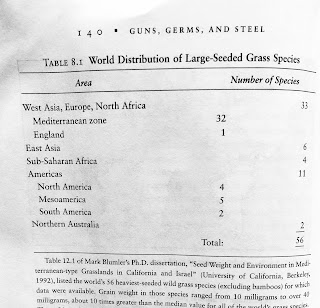
Page 140. Table 8.1. World Distribution of Large-Seeded Grass Species.
Page 160. Table 12.1 of Mark Blunder's Ph.D. dissertation, "Seed Weight and Environment in Mediterranean-type Grasslands in California and Israel" (University of California, Berkeley, 1992), listed the world's 56 heaviest-seeded wild grass species (excluding bamboos) for which data were available. Grain weight in those species ranged from 10 milligrams to over 40 milligrams, about 10 times greater than the median value for all of the world's grass species. Those 56 species make up less than 1 percent of the world's grass species. This table shows that these prize grasses are overwhelmingly concentrated in the Mediterranean zone of western Eurasia.
Page 160-161. Table 9.1 The Ancient Fourteen Species of Big Herbivorous Domestic Mammals.
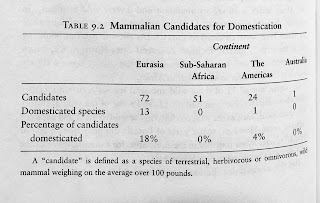
Page 162. Table 9.2 Mammalian Candidates for Domestication. A "candidate" is defined as a species of terrestrial, herbivorous or omnivorous, wild mammal weighing on the average over 100 pounds.
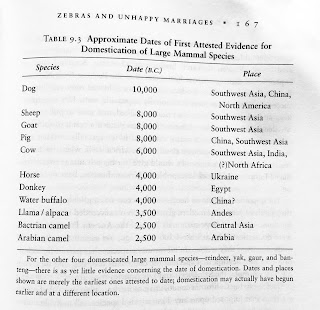
Page 167. Table 9.3 Approximate Dates of First Attested Evidence for Domestication of Large Mammal Species. For the other four domesticated large mammal species—reindeer, yak, gaur, and banteng—there is as yet little evidence concerning the date of domestication. Dates and places shown are merely the earliest ones attested to date; domestication may actually have begun earlier and at a different location.
Page 177. Figure 10.1. Major axes of the continents.
Page 181. Figure 10.2. The symbols show early radiocarbon-dated sites where remains of Fertile Crescent crops have been found. Square = the Fertile Crescent itself (sites before 7000 B.C.). Note that dates become progressively later as one gets farther from the Fertile Crescent. This map is based on Map 20 of Zohary and Hopf's Domestication of Plants in the Old World but substitutes calibrated radiocarbon dates for their uncalibrated dates.
Page 207. Table 11.1. Deadly Gifts from Our Animal Friends.
Page 219. Figure 12.1. The question marks next to China and Egypt denotes some doubt whether early writing in those areas arose completely independently or was stimulated by writing systems that arose elsewhere earlier. "Other" refers to scripts that were neither alphabets nor syllabaries and that probably arose under the influence of earlier scripts.
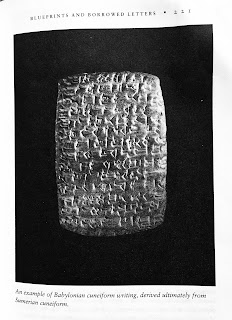
Page 221. An example of Babylonian cuneiform writing derived ultimately from Sumerian cuneiform.
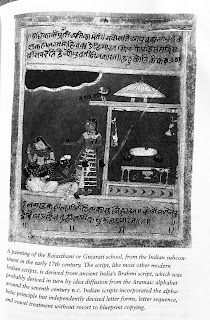
Page 223. A painting of the Rajasthani or Gujarati school, from the Indian subcontinent in the early 17th century. The script, like most other modern Indian scripts, is derived from ancient India's Brahmi script, which was probably derived in turn by idea diffusion from the Aramaic alphabet around the seventh century B.C. Indian scripts incorporated the alphabetic principle but independently devised letter forms, letter sequence, and vowel treatment without resort to blueprint copying.
Page 229. The set of signs that Sequoyah devised to represent syllables of the Cherokee language.
Page 231. A Korean text (the poem "Flowers on the Hills" by So-Wol Kim), illustrating the remarkable Hangul writing system. Each square block represents a syllable, but each component sign within the block represents a letter.
Page 232. An example of Chinese writing: a handscroll by Wu Li, from A.D. 1679.
Page 233. An example of Egyptian hieroglyphs: the funerary papyrus of Princess Entiu-ny.
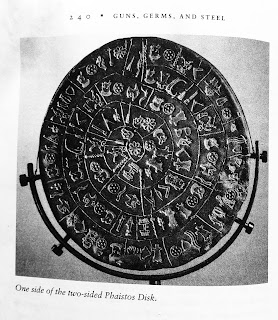
Page 240. One side of the two-sided Phaistos Disk.
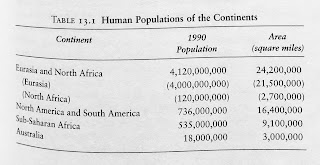
Page 263. Table 13.1 Human Populations of the Continents.
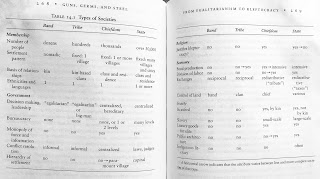
Page 268-269. Table 14.1. Types of Societies. A horizontal arrow indicates that the attribute varies between less and more complex societies of that type.
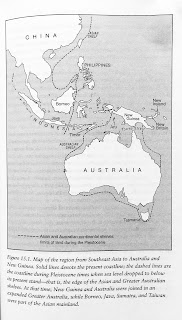
Page 299. Figure 15.1. Map of the region from Southeast Asia to Australia and New Guinea. Solid lines denote the present coastline; the dashed lines are the coastline during Pleistocene times when sea level dropped to below its present stand—that is, the edge of the Asian and Greater Australian shelves. At that time, New Guinea and Australia were joined in an expanded Greater Australia, while Borneo, Java, Sumatra, and Taiwan were part of the Asian mainland.
Page 326. Figure 16.1. The four language families of China and Southeast Asia.
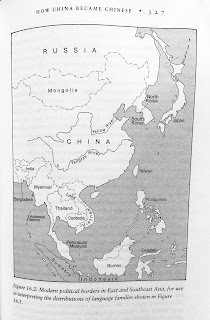
Page 327. Figure 16.2. Modern political borders in East and Southeast Asia, for use in interpreting the distributions of language families shown in Figure 16.1.
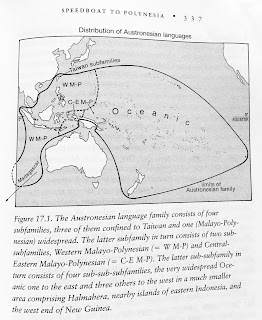
Page 337. Figure 17.1. The Austronesian language family consists of four subfamilies, three of them confined to Taiwan and one (Malayo-Polynesian) widespread. The latter subfamily, in turn, consists of two sub-subfamilies, Western Malayo-Polynesian (= W M-P) and CentralEastern Malayo-Polynesian (= C-E M-P). The latter sub-subfamily, in turn, consists of four sub-sub-subfamilies, the very widespread Oceanic one to the east and three others to the west in a much smaller area comprising Halmahera, nearby islands of eastern Indonesia, and the west end of New Guinea.
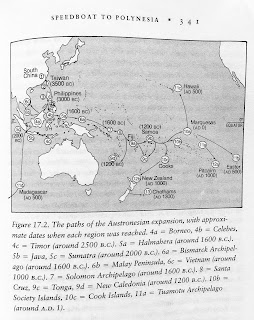
Page 341. Figure 17.2. The paths of the Austronesian expansion, with approximate dates when each region was reached. 4a = Borneo, 4b = Celebes, 4c = Timor (around 2500 B.C.). 5a = Halmahera (around 1600 B.C.). 5b = Java, 5c = Sumatra (around 2000 B.C.). 6a = Bismarck Archipelago (around 1600 B.C.). 6b = Malay Peninsula, 6c - Vietnam (around 1000 B.C.). 7 = Solomon Archipelago (around 1600 B.C.). 8 = Santa Cruz, 9c = Tonga, 9d = New Caledonia (around 1200 B.C.). 10b = Society Islands, 10c = Cook Islands, 11a = Tuamotu Archipelago (around A.D. 1).
Page 362-363. Table 18.1. Historical Trajectories of Eurasia and the Americas. This table gives approximate dates of widespread adoption of significant developments in three Eurasian and four Native American areas. Dates for animal domestication neglect dogs, which were domesticated earlier than food-producing animals in both Eurasia and the Americas. Chiefdoms are inferred from archaeological evidence, such as ranked burials, architecture, and settlement patterns. The table greatly simplifies a complex mass of historical facts: see the text for some of the many important caveats.
Page 369. Table I8.2. Language Expansions in the Old World.
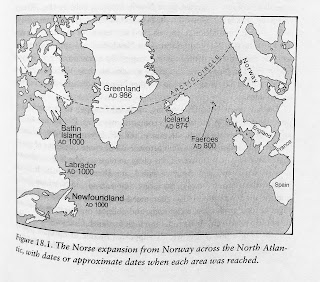
Page 371. Figure 18.1. The Norse expansion from Norway across the North Atlantic, with dates or approximate dates, when each area was reached.
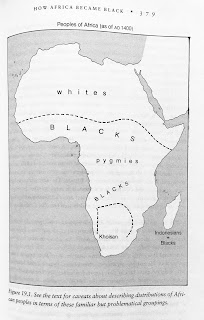
Page 379. Figure 19.1. See the text for caveats about describing distributions of African peoples in terms of these familiar but problematic groupings.
Page 382. Figure 19.2. Language families of Africa.
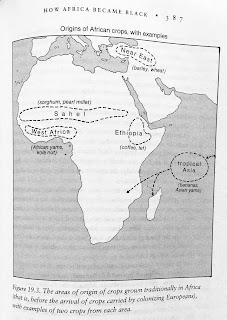
Page 387. Figure 19.3. The areas of origin of crops grown traditionally in Africa
(that is, before the arrival of crops carried by colonizing Europeans),
with examples of two crops from each area.
Page 395. Figure 19.4. Approximate paths of the expansion that carried people speaking Bantu languages, originating from a homeland (designated H) in the northwest corner of the current Bantu area, over eastern and southern Africa between 3000 B.C. and A.D. 500.
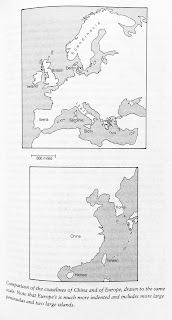
Page 415. Comparison of the coastlines of China and of Europe, drawn to the same scale. Note that Europe's is much more indented and includes more large peninsulas and two large islands. 














Wow, great job, much appreciated! Thank you so much
ReplyDelete